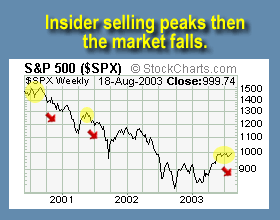
«If you take a look at the chart of the S&P 500, I have highlighted the insider selling period from July through September 2000 and the insider selling spike of May 2001.
This is what the professionals refer to as, “DISTRIBUTION!!!” The professional traders, the funds, the institutions and the insiders are all gradually selling-off to the unsuspecting retail investor. They need to have someone to sell to when they want out, so the picture is painted with a glorious economic recovery at hand, all the while the big boys are bailing out! This process has been going on for eons, or at least as long as I have been studying the stock market. If you can identify accumulation and distribution within stock chart patterns you can be forever freed from the retail market spin that pours out of CNBC. You will know when the current distribution is complete when the supports fail and the index is headed back below 800 like earlier this year. We should be testing the lows again this fall.»
O Clubeinvest.com informa que nenhuma da informação
aqui facultada deverá ser entendida como conselho ou recomendação
de qualquer tipo de transacção ou investimento.